Performance
The school performance data for the past 4 years is below:
EYFS
Good Level of Development
EYFS GLD
|
% achieving GLD |
|||
|
Whitleigh |
Plymouth |
National |
|
|
2022 |
58.3% |
63.5% |
65.2% |
|
2023 |
54% |
64.1% |
67.2% |
|
2024 |
59% |
66.7% |
67.0% |
|
2025 |
50% |
68.0% |
|
Phonics
Year 1 Phonics
|
% achieving expected standard |
|||
|
Whitleigh |
Plymouth |
National |
|
|
2022 |
52% |
76% |
75% |
|
2023 |
71% |
80% |
79% |
|
2024 |
56% |
81% |
80% |
|
2025 |
65% |
80% |
|
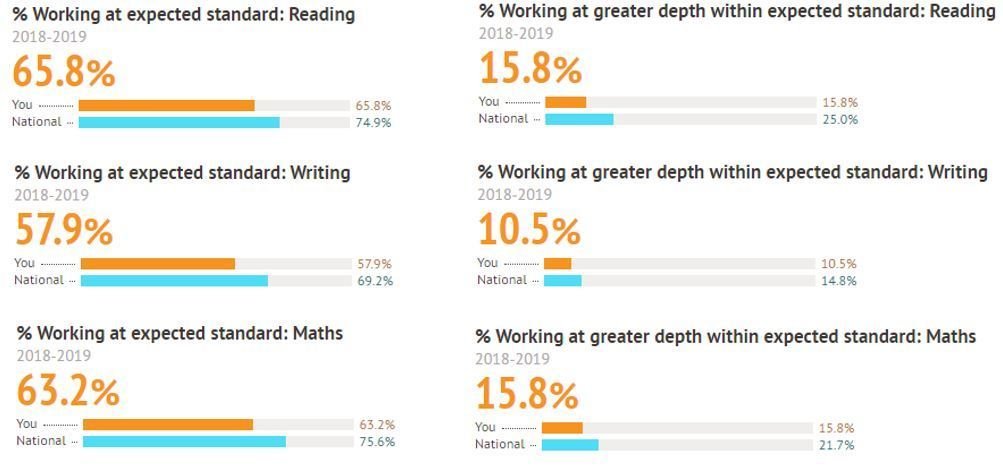
Key Stage 2
Reading, Writing and Maths combined
|
% achieving expected standard |
% achieving greater depth |
||||
|
Whitleigh |
National |
Whitleigh |
National |
||
|
2022 |
57% |
59% |
3% |
7% |
|
|
2023 |
46% |
59% |
4% |
8% |
|
|
2024 |
54% |
61% |
2% |
8% |
|
|
2025 |
50% |
62% |
2% |
8% |
|
Reading
|
% achieving expected standard |
% achieving greater depth |
Overall progress score |
||||||
|
Whitleigh |
National |
Whitleigh |
National |
Whitleigh |
National |
|||
|
2022 |
67% |
75% |
28% |
28% |
-0.73 |
0.04 |
||
|
2023 |
63% |
73% |
22% |
29% |
-1.82 |
0.04 |
||
|
2024 |
67% |
74% |
16% |
29% |
||||
|
2025 |
58% |
75% |
21% |
33% |
||||
Writing
|
% achieving expected standard |
% achieving greater depth |
Overall progress score |
||||||
|
Whitleigh |
National |
Whitleigh |
National |
Whitleigh |
National |
|||
|
2022 |
63% |
69% |
7% |
13% |
-0.31 |
0.05 |
||
|
2023 |
63% |
71% |
11% |
13% |
0.17 |
0.04 |
||
|
2024 |
63% |
72% |
5% |
13% |
||||
|
2025 |
69% |
72% |
2% |
13% |
||||
Maths
|
% achieving expected standard |
% achieving greater depth |
Overall progress score |
||||||
|
Whitleigh |
National |
Whitleigh |
National |
Whitleigh |
National |
|||
|
2022 |
65% |
71% |
8% |
22% |
-2.26 |
0.04 |
||
|
2023 |
59% |
73% |
9% |
24% |
-1.40 |
0.04 |
||
|
2024 |
61% |
73% |
14% |
24% |
||||
|
2025 |
75% |
74% |
8% |
26% |
||||